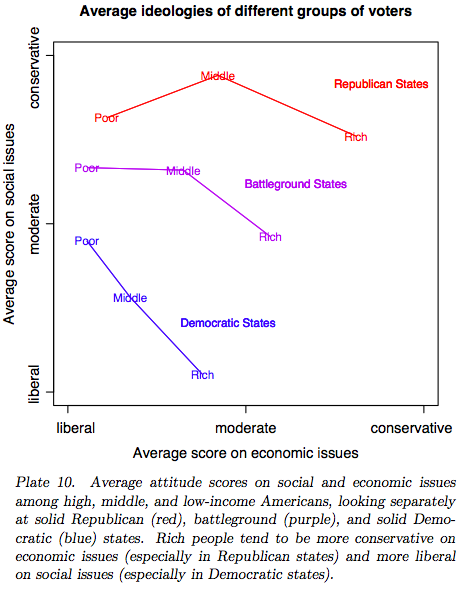
I'm trying to make some sense out of this. The chart shows each color states (red/Rep., blue/Dem., purple/battleground) as fairly equal in representation/population since the lines are equal thickness. Checking, I found one analysis (at the bottom) that red states represent 198 electoral votes, blue 257, and purple 83. So, perhaps the purple line is not needed and we should look more at the blue one.
The chart shows that the poor are all economically liberal. Duh? The poor are also generally socially conservative, however blue represents a greater population. So the poor are mostly moderate in regards to social issues with Republican poor being a bit more conservative socially. No surprise there.
The chart also shows that Republican states are generally more conservative socially and economically than Democratic states. Again, a big Duh.
The chart concludes at the bottom that "Rich People tend to be more conservative on economic issues…and more liberal on social issues…. This is fairly misleading, since the blue line again represents a greater population. Actually the rich tend to be moderate on economic issues with the Republicans more conservative. If there is anything surprising in the chart, it may be the wide difference between the Republican versus the Democratic rich. It may be interesting to study how the Republican rich got their money versus the Democratic rich.
The major problem I have with understanding this chart is what are conservative vs liberal social and economic issues. Not only is it confusing to me but also seems to contribute to the growing separatism during the last 10 years.
Here is my best guess on the issues, but I could be way off base: Abortion: social liberal Incredible powerful military and tendency to go to war at any perceived threat: economic liberal Restrict human rights and use torture: social conservative, economic liberal Restrict right to bear arms: social liberal Restrict religious beliefs in public education: social liberal Restrict religious beliefs in where to build churches: social conservative Restrict immigration: social conservative, economic conservative (short term) Government bailouts: economic liberal Progressive income tax structure: social liberal, economic liberal (but balance budget would be economic conservative) Income tax deductions and exemptions: social liberal, economic conservative or liberal depending on the deductions. Corporate election contributions and lobbying: economic liberal, I guess
I guess I just don't get any clear picture as to how party affiliation and wealth relate to the issues from this graph.
6 comments:
I'm trying to make some sense out of this. The chart shows each color states (red/Rep., blue/Dem., purple/battleground) as fairly equal in representation/population since the lines are equal thickness. Checking, I found one analysis (at the bottom) that red states represent 198 electoral votes, blue 257, and purple 83. So, perhaps the purple line is not needed and we should look more at the blue one.
The chart shows that the poor are all economically liberal. Duh? The poor are also generally socially conservative, however blue represents a greater population. So the poor are mostly moderate in regards to social issues with Republican poor being a bit more conservative socially. No surprise there.
The chart also shows that Republican states are generally more conservative socially and economically than Democratic states. Again, a big Duh.
The chart concludes at the bottom that "Rich People tend to be more conservative on economic issues…and more liberal on social issues…. This is fairly misleading, since the blue line again represents a greater population. Actually the rich tend to be moderate on economic issues with the Republicans more conservative. If there is anything surprising in the chart, it may be the wide difference between the Republican versus the Democratic rich. It may be interesting to study how the Republican rich got their money versus the Democratic rich.
The major problem I have with understanding this chart is what are conservative vs liberal social and economic issues. Not only is it confusing to me but also seems to contribute to the growing separatism during the last 10 years.
Here is my best guess on the issues, but I could be way off base:
Abortion: social liberal
Incredible powerful military and tendency to go to war at any perceived threat: economic liberal
Restrict human rights and use torture: social conservative, economic liberal
Restrict right to bear arms: social liberal
Restrict religious beliefs in public education: social liberal
Restrict religious beliefs in where to build churches: social conservative
Restrict immigration: social conservative, economic conservative (short term)
Government bailouts: economic liberal
Progressive income tax structure: social liberal, economic liberal (but balance budget would be economic conservative)
Income tax deductions and exemptions: social liberal, economic conservative or liberal depending on the deductions.
Corporate election contributions and lobbying: economic liberal, I guess
I guess I just don't get any clear picture as to how party affiliation and wealth relate to the issues from this graph.
If nothing else, the chart seems to confirm Larry M. Bartels' What's the Matter with What's the Matter with Kansas
cited by James in an earlier comment to What is Obama Thinking?
Poor people from any state are liberal on economic issues.
Ha, ha, ha. I should have known there was some method in your madness.
Post a Comment